
Field notes / 05 ·
Open to bots.
Closed to abuse.
An AI reading our public pages is welcome. A scanner hunting for exposed backups is a different request. We want a website that can serve the first generously and reject the second early. Monitoring is the first piece of that work.
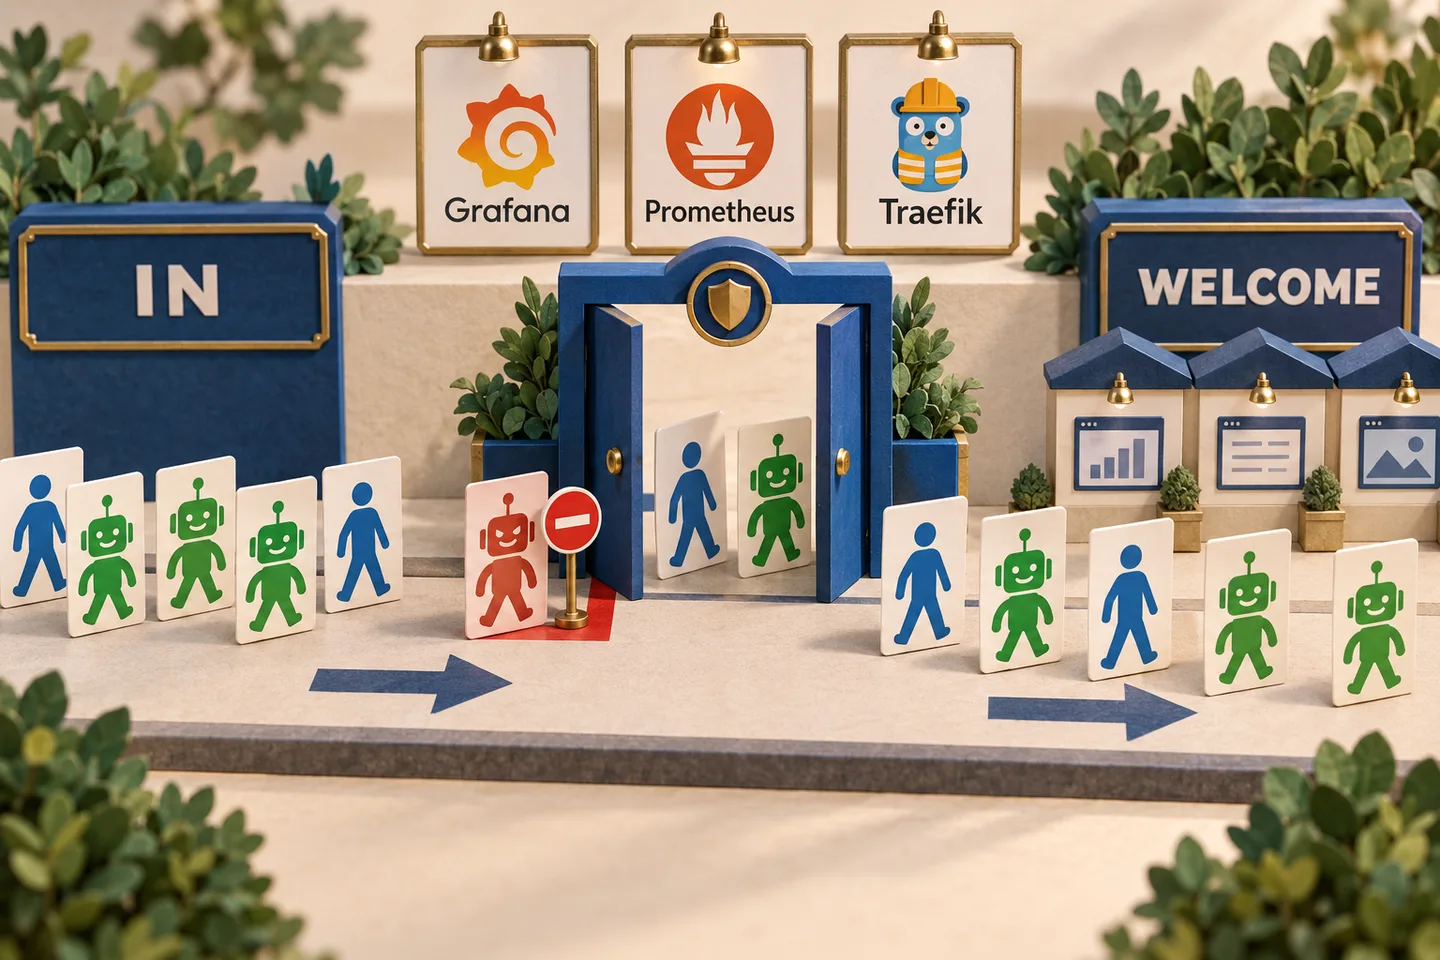
01 / The visitor may be a machine
Automation belongs in the audience.
Someone can discover a website through an AI answer, ask an assistant to read an article, or send an agent to compare information across several pages. The request reaching the server may come from a bot, while the interest behind it is entirely real. Search crawlers and other legitimate automation belong here too.
GEO, or generative engine optimization, makes this an access question as well as a publishing question: can the systems that discover and retrieve our content actually read it? For HAIH, visibility in that environment matters. We want our public work to be available to AI systems and ordinary bots, including ones we have not met before.
Google's guidance for AI search features keeps the fundamentals familiar: accessible crawling, indexable text and eligibility for ordinary search. It explicitly includes access through the hosting infrastructure, not just robots.txt. Access is a prerequisite we can work on; it does not guarantee indexing or a citation in an AI answer.
A machine asking to read is not, by itself, a reason to close the door.
02 / An expensive shortcut
A quieter server can also be a less visible website.
When unwanted traffic grows, putting the site behind a protective proxy and challenging automated visitors is an appealing shortcut. But a policy that demands a human browser from every reader can also obstruct the crawlers and agents we want to serve. Fewer requests is not automatically a better result.
This is a policy choice, not an inevitable property of Cloudflare or any other proxy. Cloudflare itself provides individual AI crawler controls. Our objection is to treating automation as sufficient grounds for rejection. Search, retrieval and model training also have different purposes; their access policies should be deliberate.
At the same time, repeated attempts to fetch database dumps, secret files or administration endpoints for software we do not run have a real cost. They consume resources and fill request statistics with activity that says little about interest in the website. We need to reduce that waste without erasing useful automated readership.
03 / Two requirements, together
Make openness affordable.
Performance
Make legitimate requests cheap enough to serve in large numbers. Reuse work, serve cacheable content efficiently and measure the limits under representative traffic.
Openness
Welcome people, AI systems and other bots to public content. Reject clearly malicious requests because of what they do, rather than because their sender is automated or unfamiliar.
These requirements support each other. If every additional crawler is expensive, blanket blocking becomes tempting. Our existing built pages and Varnish cache provide ways to reuse responses instead of repeating application work. The server field note describes that delivery path and its current limitations.
Handling very large request volumes is an engineering target, not a capacity claim established by this monitoring commit. Cached pages, uncached APIs and random missing URLs create different workloads. We still need representative measurements to learn where the system slows down and which work reaches the application.
04 / Observe before deciding
One server, one shared view.
The monitoring foundation was built with this selective anti-abuse work in mind. Several sites on a server can share its Traefik entry point and one monitoring installation. There is no need to duplicate the entire monitoring stack for every site. Its purpose is local: understand the websites served by this particular server.
- Traefik
- Observes incoming requests: paths, statuses, response times and HTTP traffic volume, with separate page, API and asset routes.
- Prometheus + Grafana
- Keep measurements over time and make them readable by site: traffic, errors, latency, availability and server resources.
- Loki + Alloy
- Bring request and application logs into the same investigation, so a graph can lead to the events behind it.
- Blackbox Exporter + Node Exporter
- Check pages and APIs regularly and expose the host's CPU, memory and disk condition.
- Alertmanager
- Groups alerts and can deliver failure and recovery messages through optional email and Telegram channels.
The owner registers the sites and their checks explicitly. Monitoring is a deployment choice in this architecture; at this checkpoint its services are included in the shared Compose configuration, rather than offered as a finished on/off profile. Connecting an existing server therefore still requires deliberate configuration.
The shared cost is real. Local observations recorded roughly 594–714 MiB of memory across the seven monitoring containers, excluding Traefik, Varnish and the application. That is a short observation, not a fixed budget. Sharing makes the cost server-wide; it does not make it disappear.
05 / A dashboard is not a classifier
Keep useful bots in the picture.
Today, these graphs include all observed traffic. The commit does not identify good bots, block scanners or produce a clean human-audience report. It gives us the request evidence and operational measurements from which the owner can build that policy.
The eventual view should distinguish human readership, useful automation, rejected abuse and requests we cannot confidently classify. Useful bot traffic deserves its own visibility: it can be part of discovery, not simply noise to subtract. Unknown does not mean hostile, and a bot's self-declared name does not prove it is safe.
Likewise, a single 404 can be a broken link or an outdated search result. It is not enough to declare an attack. Attempts to retrieve private configuration or repeated scans of irrelevant administration paths are more specific signals. The current logs help with paths and outcomes; richer identification would need additional signals and validation, not guesses presented as accurate audience statistics.
06 / The owner's local policy
Start narrow. Check both sides of the gate.
We do not yet have a complete answer to selective protection. The concrete rules belong to the owner who knows what each site runs and what access it needs. AI can help inspect examples and prepare a configuration, but the result still needs evidence.
- Establish what should remain open. Identify public pages and APIs, useful crawlers and the site's real administration paths. Keep access open to unfamiliar legitimate automation too.
- Observe the actual requests. Look for repeated, clearly irrelevant exploit and dump probes. Compare their volume with application load; keep ambiguous requests separate from confirmed abuse.
- Try a small set of rules. Review which requests would match before enforcing them. A WordPress-specific rule may make sense for a site without WordPress, but must not become a server-wide assumption when another site uses it.
- Reject early and keep a record. Apply the chosen mechanism at the shared entry layer, before application work. Record the reason and site separately so rejected requests do not disappear or inflate useful-traffic reports.
- Verify access as well as rejection. Confirm that matched abuse no longer reaches Node.js, while people and legitimate bots still receive the intended content. Watch for mistaken blocks and adjust or roll back the rule.
This is a proposed operating process, not a feature enabled by opening Grafana. The rejection mechanism and classification rules still need to be selected and connected locally. robots.txt can communicate crawling preferences; it does not enforce protection against a client that ignores them. Private data also remains private regardless of how welcome a crawler is on public pages.
07 / Evidence at this revision
The observation layer has been exercised.
The recorded local verification checked healthy metric collection, page and API probes, request logs, dashboard queries and GraphQL errors, including errors returned with HTTP 200. A generated two-site configuration kept their labels and checks separate; the running preview contained one site.
One experiment paused the application. A warmed page still worked through Varnish, while the uncached API probe failed and triggered an alert. After the application resumed, the check recovered and the alert resolved. That distinction matters: a working cached page alone does not establish that the application behind it is healthy.
Failure and recovery notifications reached isolated local email and Telegram test receivers. Delivery to real recipients remains to be configured and verified. These checks ran in a local production preview, not against the public server.
08 / The direction
Measure whether the door stays open.
Our next question is not how many bots we can stop. It is whether we can serve useful requests efficiently while moving clearly malicious work away from the application. Success needs both observations: less wasted work and continued access for the readers and machines we want to welcome.
This checkpoint gives us a shared place to investigate that question. Performance and openness remain the two requirements against which the next solution must be judged. We have a direction, a working observation layer and an unfinished policy to test against reality.